Integration of prometheus and grafana

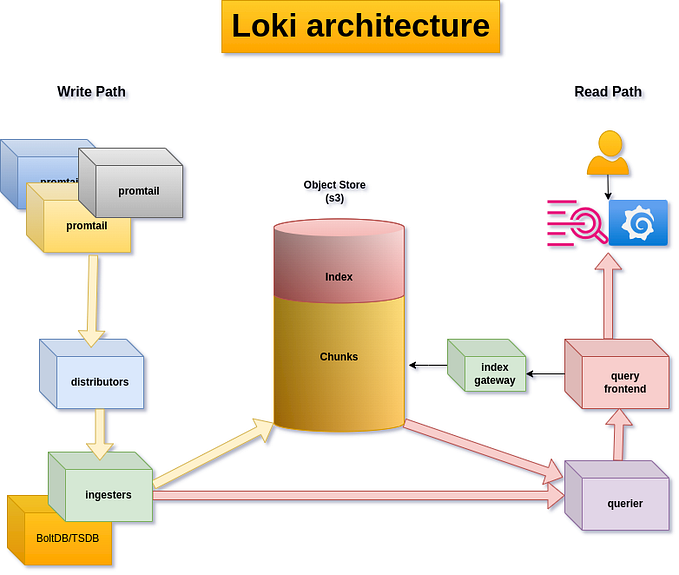
Prometheus: Prometheus is a devops tool which is used in monitoring . In devops monitoring is the process by which software, RAM , cpu and node is monitored , this process used in security also for monitor the activity of hacker.
In monitoring prometheus collect data only in matrics form in real time .
Prometheus work as a server which demand information from exporter then exporter gives the information and store data in TSDB( time series data base) .
Prometheus support regex for getting data .
When target is used node for monitoring then it’s called nodel instrumentation, when target is webserver then it’s known as service instrumentation , when target is php code then it’s known as app instrumentation.
Grafana: Grafana is the devops tool , which is used in monitoring . In grafana data is visualized using graph . when grafana is integrated with prometheus then grafana demand information every second to prometheus and visualize in graph .
Project description:
Integrate Prometheus and Grafana and perform in following way:
- Deploy them as pods on top of kubernetes by creating resources Deployment , ReplicaSet , Pods or Services
- Make their data to be remain persistent
- And both of them should be exposed to outside world
First of all ,i have created my own docker image using “prom/prometheus
In Dockerfile, i have added prometheus.yml file in which job is cofigured .
Dockerfile:
FROM prom/prometheus
ADD prometheus.yml /etc/prometheus/
After that , built docker image and uploaded that image on docker hub using below cmd
docker build -t myprom_image:v1 .
docker tag myprom_image:v1 firsttalk26/myprom_image:v1
docker push firsttalk26/myprom_image:v1
After upload image on docker hub , i have created a configuration file for deploy Prometheus on Kubernetes
Configuration file :
myprometheus.yml
apiVersion: v1
kind: Service
metadata:
  name: prometheus-service
  labels:
    app: prometheus-app
spec:
  ports:
    - port: 9090
      nodePort: 30003
  selector:
    type: prometheus
  type: NodePort
---
apiVersion: v1
kind: PersistentVolumeClaim
metadata:
  name: pvc-prometheus
spec:
  accessModes:
    - ReadWriteOnce
  resources:
    requests:
      storage: 5Gi
---
apiVersion: apps/v1
kind: Deployment
metadata:
  name: prometheus-deploy
  labels:
    app: prometheus-app
    type: prometheus
spec:
  selector:
    matchLabels:
      type: prometheus
  strategy:
    type: Recreate
  template:
    metadata:
      labels:
        app: prometheus-app
        type: prometheus
    spec:
      containers:
      - image: firsttalk26/myprom_image:v1
        name: myprometheus
        ports:
        - containerPort: 9090
          name: myprometheus
        volumeMounts:
        - name: prometheus-pv
          mountPath: /root/prometheus/data
      volumes:
      - name: prometheus-pv
        persistentVolumeClaim:
          claimName: pvc-prometheus
After creation of cofiguration file, i have i have launched Prometheus deployment , service and pvc using below cmd
kubectl create -f myprometheus.ymlAfter launch of Prometheus , i have created a configuration file of grafana
Configuration file:
mygrafana.yml
apiVersion: v1
kind: Service
metadata:
  name: grafana-service
  labels:
    app: grafana-app
spec:
  ports:
    - port: 3000
      nodePort: 30002
  selector:
    type: grafana
  type: NodePort
---
apiVersion: v1
kind: PersistentVolumeClaim
metadata:
  name: pvc-grafana
spec:
  accessModes:
    - ReadWriteOnce
  resources:
    requests:
      storage: 1Gi
---
apiVersion: apps/v1
kind: Deployment
metadata:
  name: grafana-deploy
  labels:
    app: grafana-app
    type: grafana
spec:
  selector:
    matchLabels:
      type: grafana
  strategy:
    type: Recreate
  template:
    metadata:
      labels:
        app: grafana-app
        type: grafana
    spec:
      containers:
      - image: grafana/grafana
        name: mygrafana
        ports:
        - containerPort: 3000
          name: mygrafana
        volumeMounts:
        - name: grafana-pv
          mountPath: /var/lib/grafana
      volumes:
      - name: grafana-pv
        persistentVolumeClaim:
          claimName: pvc-grafana
After creating configuration file , i have launched grafana using below cmd
kubectl create -f mygrafana.ymlI have integrated Prometheus and Grafana and visulized data on Grafana as a graph .
For integrate Grafana with Prometheus , i have added data source for get data to visualize on graph .
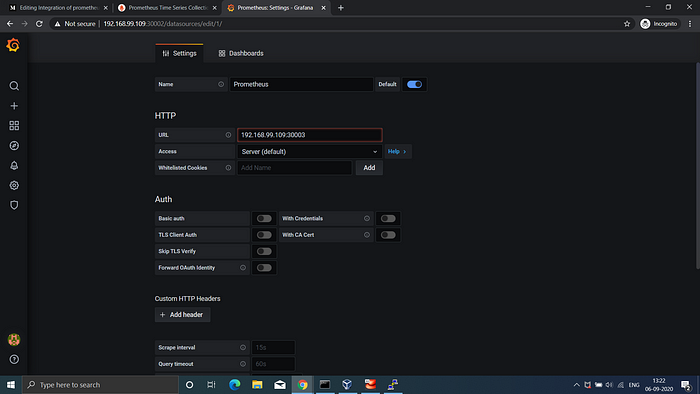

After added data source create new panel for store data and visualize . I used promQL for searching data